Debugging is an essential aspect of full-stack development, enabling developers to identify and resolve issues that impact functionality, performance, and user experience. Whether it’s a broken API call, a slow database query, or a misaligned UI component, understanding common issues and how to tackle them can significantly improve the reliability and scalability of your applications.
In this detailed guide, we’ll explore some of the most frequent challenges developers face in full-stack applications, strategies to overcome them, and tools to make debugging more efficient.
Why Debugging Is Critical in Full-Stack Development
Debugging is not just about fixing code; it’s about uncovering the underlying reasons for system failures and implementing sustainable solutions. It enhances the reliability of your application, improves code quality, and builds confidence in your work.
For full-stack developers, debugging is a core skill that complements other technical proficiencies. To better understand the competencies required for excelling in this role, check out this list of essential skills every full-stack CMS developer needs.
Common Full-Stack Issues and How to Address Them
1. Backend Errors and Exceptions
Backend issues often arise from unhandled exceptions, missing validations, or configuration mismatches. These errors can lead to API failures or server crashes, resulting in a poor user experience.
Solution:
- Implement robust error-handling middleware in your backend framework.
- Use logging tools like Winston or Log4j to monitor and record errors in production environments.
- Reference this detailed guide on error handling in backend applications for actionable strategies to manage exceptions effectively.
2. Database Query Failures
Database issues can range from incorrect queries returning unexpected results to performance bottlenecks due to unoptimized schema designs or missing indexes.
Solution:
- Use tools like SQL Profiler for relational databases or MongoDB Compass for NoSQL databases to monitor query execution.
- Ensure that your database is properly indexed, and queries are optimized.
- Validate input data to avoid SQL injection or NoSQL injection vulnerabilities.
3. Frontend Rendering Problems
Frontend issues include layout misalignments, broken user interactions, or mismatched data binding between the UI and the backend.
Solution:
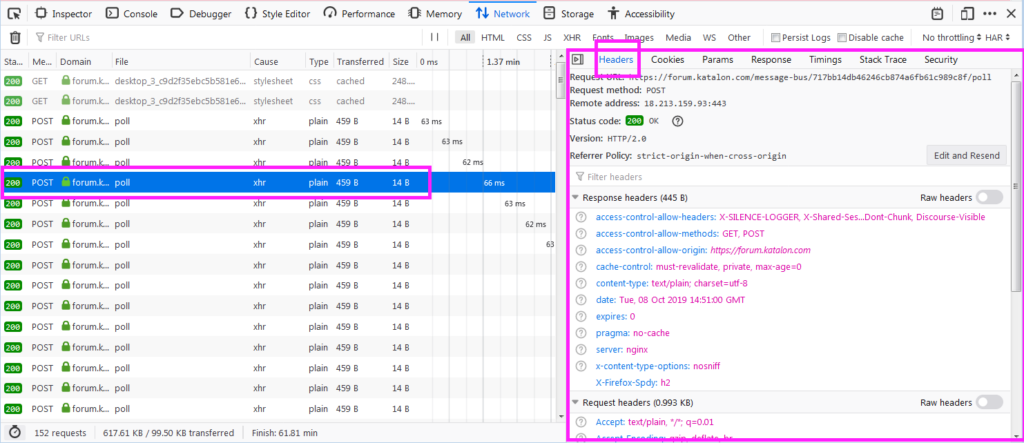
- Debug using browser developer tools to inspect elements, check console logs, and analyze network requests.
- Utilize framework-specific tools like React DevTools or Vue DevTools for component-level debugging.
- Ensure consistent styling by using CSS preprocessors and tools like PostCSS. For more on CSS and its impact on full-stack development, explore this guide on understanding CSS for full-stack developers.
4. API Integration Issues
APIs are the backbone of full-stack applications, and their failure can result in incomplete or erroneous data exchange.
Solution:
- Use API testing tools like Postman or Insomnia to validate endpoints.
- Log API requests and responses for analysis in case of failures.
- Implement timeout mechanisms and retry policies to handle flaky APIs.
Debugging Best Practices
- Reproduce the Issue: Ensure the problem can be replicated consistently in your development environment. This step helps in isolating the root cause.
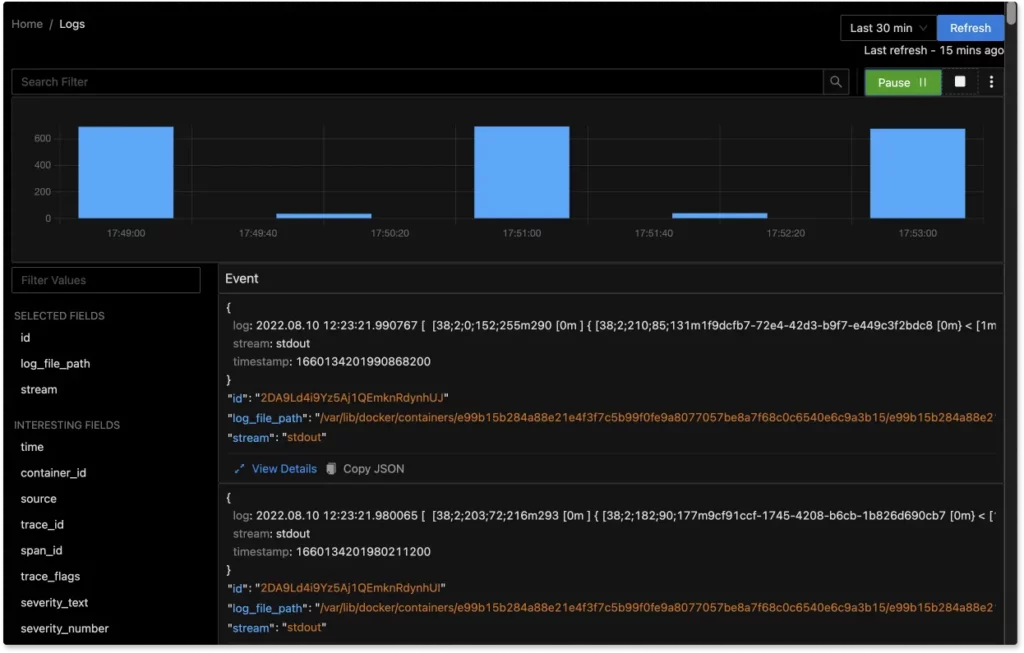
- Analyze Logs: Logs provide insights into what went wrong and where. Use structured logging for better readability and filtering.
- Use Breakpoints: Debuggers in IDEs like Visual Studio Code or JetBrains IntelliJ allow you to pause execution and inspect variable states step-by-step.
- Test Incrementally: Debug in smaller, isolated parts of your application to pinpoint the exact location of the problem.
“Debugging is not about fixing the problem. It’s about understanding it well enough to ensure it never happens again.” — Experienced Full-Stack Developer
Advanced Debugging Techniques
1. Remote Debugging
Debugging live applications is challenging but essential for resolving production issues. Tools like Chrome DevTools (for browser debugging) and SSH (for server debugging) enable remote analysis.
2. Using Unit and Integration Tests
Automated tests help catch issues early. Writing tests for individual components (unit tests) and testing interactions between them (integration tests) can prevent regressions.
3. Collaboration and Peer Reviews
Code reviews and pair debugging with teammates can bring new perspectives to problem-solving.
4. Profiling Tools
Use tools like Chrome Performance Profiler, Lighthouse, or Node.js Performance Hooks to analyze performance bottlenecks.
Setting Up Your Debugging Environment
A productive debugging environment includes:
- Frontend Debugging Tools: Browser developer tools, React DevTools, or Vue DevTools for UI debugging.
- Backend Debugging Tools: IDE-based debuggers, Postman for API testing, and monitoring logs.
- Database Debugging Tools: SQL Profiler, DBeaver, or Robo 3T for querying and optimizing databases.
Image Suggestion 1:
Writing Efficient Debugging Logs
- Structured Logging: Use JSON format to make logs easy to parse and analyze.
- Log Levels: Categorize logs into levels like INFO, DEBUG, WARN, and ERROR for better filtering.
- Log Rotation: Archive older logs to avoid disk space issues.
Image Suggestion 2:
Debugging Complex Full-Stack Applications
For large-scale applications, debugging becomes more complex as it involves multiple systems. A comprehensive understanding of the full development stack is essential. Refer to this comprehensive guide on mastering full-stack web development for insights into building robust systems.
Conclusion
Debugging is a continuous process that not only resolves issues but also enhances your development skills and application reliability. By following best practices, leveraging appropriate tools, and maintaining a proactive mindset, you can handle even the most challenging full-stack issues with confidence.
For more detailed insights on full-stack development, from error handling to essential skills, explore the resources linked above. Debug smart, and build with confidence!
